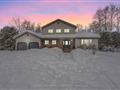
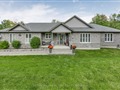
80 Huronwoods Dr
$754,415
Comparative Market Analysis
Jun 14, 2025
NOT AN ACTIVE LISTING
Historical Performance
| Period | $ Change | % Change |
| 1 Day | +$262 | +0.035% |
| 7 Days | +$294 | +0.039% |
| 30 Days | -$1,045 | -0.138% |
| 3 Months | -$2,114 | -0.279% |
| 6 Months | +$11.8k | +1.59% |
| 1 Year | -$35.4k | -4.48% |
| 3 Years | +$134k | +21.6% |
| 5 Years | +$224k | +42.3% |
| 10 Years | +$443k | +142% |
List My Property
Real Estate Statistics
Financing Solutions
AS SEEN ON


Are You a Licensed Real Estate Agent or Broker?